

The Question Teachers Ask: "What Does the Gradient Mean?"
I draw a straight line on the board. Two points, a small triangle underneath, and a student works out the gradient: 2.
"Good. What does that 2 mean?"
Silence. Every time.
Students can calculate a gradient long before they can explain one. That gap does not usually show up in class; it shows up in the exam, in the second half of a question, where the marks are not for the number but for what the number says about the situation. This article is not about how to calculate a gradient. It is about what to do with it once you have.
Gradient = Rate of Change
Every gradient, in every subject, answers the same question: for every one step across, how many steps up or down?
Take two points on a line: (1, 3) and (4, 9). The change in y is 6, the change in x is 3, so the gradient is 2. For every 1 unit moved across, the line rises 2 units.
In pure mathematics, the gradient is 2 (pure scalar ratio). For every 1 step across, the line climbs 2 units up.
That sign matters as much as the size:
- Positive gradient: as x increases, y increases. The line climbs.
- Negative gradient: as x increases, y decreases. The line falls.
- Zero gradient: y does not change at all. A completely flat horizontal line.
None of that is new to most students by the time they reach IGCSE. What is new, and what most revision skips, is that the formula never tells you what the axes are.
The Same Formula, Different Meaning
Change in y over change in x is the entire idea. But the same calculation means something completely different depending on what is on the two axes.
For a line y = mx + c, the gradient is m, a fixed, unitless number describing steepness. It answers a question about pure geometry and shape.
The axes carry physical units, and the gradient inherits them. It transforms into a physical quantity: a speed, an acceleration, or a rate of change.
The number does not change how it is calculated. It changes what it is allowed to mean.
This is the habit worth building before Year 10: before touching the formula, look at the axes and ask what one unit of "up" and one unit of "across" actually represent.
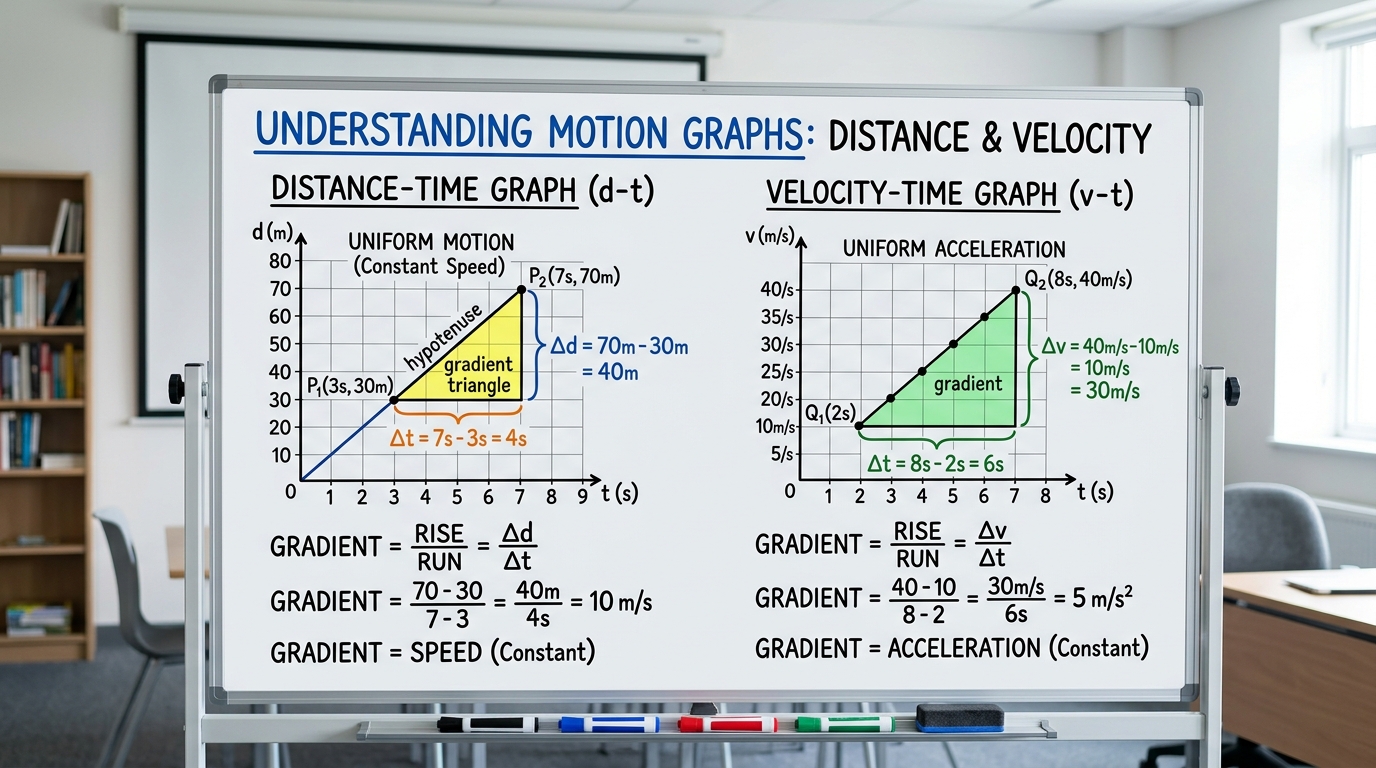
Distance-Time Graphs: Gradient = Speed
Take a distance-time graph. The y-axis is distance in metres, the x-axis is time in seconds.
A student walks from 0 m to 30 m in 6 seconds, along a straight line. The gradient is 30 ÷ 6 = 5.
Now the interpretation: the units of the gradient are metres ÷ seconds, or m/s. The number 5 is not an abstract steepness; it is the student's speed. Five metres, every second.
The units are metres divided by seconds (m/s). Flat line = zero speed (at rest), steeper line = higher speed.
- • A steeper line means a faster speed (more distance covered per second).
- • A flat horizontal section means the object has stopped (zero speed, not zero distance).
- • A gradient that changes partway means the speed itself changed (acceleration or deceleration).
This is where marks are usually lost. A student can calculate "5" correctly and still fail to write "5 m/s, meaning the object travelled at a constant speed of 5 metres per second," which is the sentence the mark scheme is actually looking for.
For students still shaky on rearranging the y = mx + c side of this before applying it to graphs, our piece on IGCSE maths revision and why hours of practice don't always convert into marks covers the algebra habit that usually needs fixing first. Ustaad's maths tutoring works through exactly this kind of graph-reading gap one-to-one.
Velocity-Time Graphs: Gradient = Acceleration
Change the y-axis to velocity, in m/s, and keep time in seconds on the x-axis. Same formula. Different meaning again.
A car's velocity rises from 0 to 12 m/s over 6 seconds. Gradient = 12 ÷ 6 = 2. The units are now m/s ÷ s, or m/s². This is acceleration, the rate at which velocity itself is changing.
On a v-t graph, negative gradient indicates deceleration (slowing down), while flat section means travelling at steady speed (zero acceleration).
The genuinely useful part is the negative case. A negative gradient on a velocity-time graph does not mean the object is moving backwards. It means the object is decelerating: slowing down while still travelling forward. Students who treat every negative number as "wrong" or "moving in reverse" are usually missing this distinction, and it is a common point lost in mechanics questions.
This is precisely the reading gap covered from the physics side in why IGCSE Physics formulas stop working in exams, where the same equation behaves differently once a real situation and real units are attached to it. Families working through this at home can also look at Ustaad's physics tutoring, which builds graph interpretation into every mechanics topic rather than treating it as a separate skill.
A Common Student Mistake
"I calculated the gradient, so I'm finished."
This is the sentence behind more lost marks than any formula error. Exam questions rarely ask for the gradient as an end in itself. They ask for the gradient and what it tells you: the speed, the acceleration, the rate of reaction, the rate of change of profit. Skipping the interpretation line is the same mistake, whichever subject it happens in: the calculation is right, and the answer is still incomplete.
Mark schemes are usually built around this exact split: one mark for the correct number and a separate mark for stating what it means in context, with units. Students who stop at the number are handing back marks they have already earned.

Teacher Challenge: Read the Graph
Picture a velocity-time graph: velocity rises in a straight line from 0 m/s to 20 m/s over 4 seconds, then stays flat at 20 m/s for the next 3 seconds.
Graph Scenario: Velocity increases steadily from 0 m/s to 20 m/s in 4 seconds, then remains flat at 20 m/s for 3 seconds.
If the answer to question 3 stops at "the units are m/s²" without saying what that means physically, that is the exact half-answer this article has been describing.
Teacher's Takeaway
The formula calculates the gradient. The axes tell you what the gradient means.
That one sentence is worth more at exam time than another hour of practising the calculation itself, because the calculation was never the part students were losing marks on. Once a student checks the axes before they touch the formula, distance-time, velocity-time, and every other graph they meet (in maths, physics, economics, or biology) starts reading the same way.
Ustaad supports Maths and Physics students across the UAE through diagnostic, concept-led learning aligned to IGCSE, A-Level, and IB curricula. Book a free trial to find out exactly where the gaps are.
No commitment. Cancel anytime.
Frequently Asked Questions
Maths & Physics Specialist
A practising Maths and Physics specialist coaching IGCSE, GCSE, and A-Level students across Dubai and Abu Dhabi, focusing on conceptual clarity, graph literacy, and mark scheme precision.
Nida Iqbal | MPhil in Education Leadership and Management
Nida Iqbal reviewed this article for pedagogical accuracy, verifying that the cross-curricular maths and physics graph explanations reflect standard UK and IB mark scheme criteria.
Ustaad supports Maths and Physics students across the UAE through diagnostic, concept-led learning aligned to IGCSE, GCSE, A-Level, and IB curricula.
No commitment. Cancel anytime.
 Ask on WhatsApp
Meet the writers behind Ustaad UAE on our editorial page.