

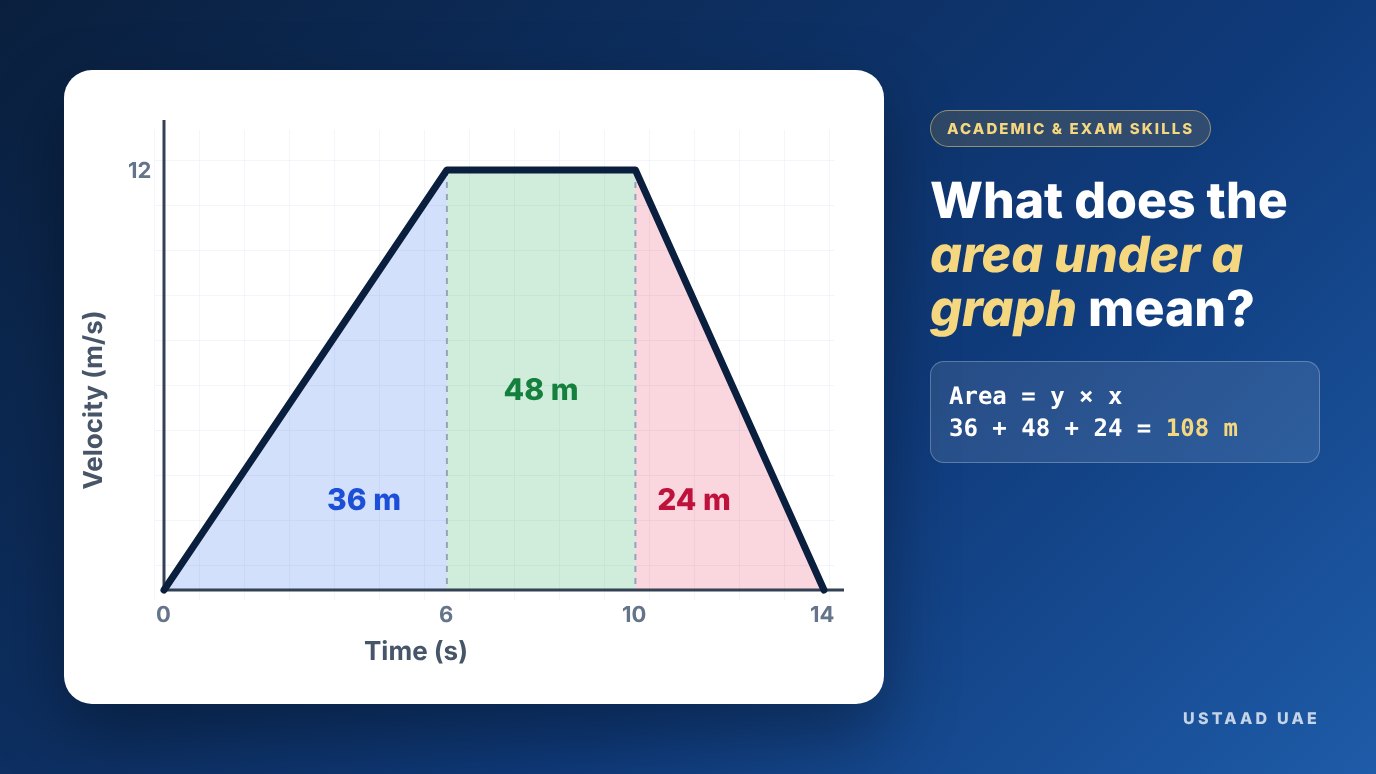
The area under a graph is the y-quantity multiplied by the x-quantity. On a velocity-time graph it is the distance travelled (m/s × s = m). On a force-extension graph it is the work done, or elastic potential energy (N × m = J). On a current-time graph it is the charge that flowed (A × s = C).
Why the Area Under a Graph Confuses Students
In my last article on what the gradient actually means, the lesson was simple: the formula calculates the number, and the axes tell you what it means. The area under a graph works the same way, but students find it harder for one reason. The gradient is a slope you can see. The area is empty space under a line, and nobody tells you it stands for anything.
So a student can split a velocity-time graph into a neat triangle and rectangle, add them, and write "108". Then the question asks, "What does this value represent?" and the answer is a guess.
The good news is that one habit answers every area question you will meet, in Physics and in Maths.
The Units Trick: Area Means y × x
Area is always the quantity on the y-axis multiplied by the quantity on the x-axis. So before calculating anything, multiply the units of the two axes. The result tells you exactly what the area represents.
Velocity (m/s) × time (s) = metres, so the area is a distance. Force (N) × extension (m) = newton-metres, which are joules, so the area is energy. You do not need to memorise a list. You need to multiply two units.
Velocity-Time Graphs: Area = Distance Travelled
This is the area question that appears on almost every IGCSE and GCSE Physics paper. A car accelerates from rest to 12 m/s in 6 seconds, travels at 12 m/s for 4 seconds, then brakes to a stop in 4 seconds. How far does it travel?
Accelerate for 6 s, cruise at 12 m/s for 4 s, then brake for 4 s. Each shape is a separate distance, and the total is 108 m.
Split the region between the line and the time axis into simple shapes, find each area, and add them:
- Triangle A (accelerating): ½ × 6 × 12 = 36 m
- Rectangle B (constant velocity): 4 × 12 = 48 m
- Triangle C (braking): ½ × 4 × 12 = 24 m
Total distance = 36 + 48 + 24 = 108 m. Notice that the braking section still adds distance. The car is slowing down, but it is still moving forwards.
Any section where velocity changes steadily from u to v is a trapezium. Its area is ½ × (u + v) × t. That is exactly the SUVAT equation s = ½(u + v)t. The equation and the graph are the same idea written two ways, and examiners love questions that check you can move between them.
If converting units is where your child usually slips, check the axes before calculating. A time axis in minutes or a velocity axis in km/h will give the right shape and the wrong answer. Ustaad’s physics tutoring drills this check until it becomes automatic.
Speed-Time vs Velocity-Time: Area Below the Axis
At IGCSE and GCSE, most graphs stay above the time axis, and the area under a speed-time graph and a velocity-time graph both give the distance travelled. At A-Level, velocity can become negative, which means the object is moving backwards.
Distance travelled = 20 + 5 = 25 m. Displacement = 20 − 5 = 15 m from the start.
Area above the axis is displacement in the positive direction. Area below the axis is displacement in the negative direction. That leads to two different answers, and the question wording decides which one you need:
- Total distance travelled: add the sizes of all areas. 20 + 5 = 25 m.
- Final displacement: subtract the area below the axis. 20 − 5 = 15 m from the start.
Other Graphs Where the Area Matters
Once the units trick clicks, the same skill unlocks questions across the Physics specification. These are the ones that appear most often:
| Graph | y × x units | Area represents | Level |
|---|---|---|---|
| Velocity-time | m/s × s = m | Displacement / distance | IGCSE, GCSE |
| Force-extension | N × m = J | Work done, elastic PE | GCSE, A-Level |
| Current-time | A × s = C | Charge flowed | GCSE, A-Level |
| Acceleration-time | m/s² × s = m/s | Change in velocity | A-Level |
| Force-time | N × s = N s | Impulse (change in momentum) | A-Level |
| Power-time | W × s = J | Energy transferred | A-Level |
Force-extension example: a spring obeys Hooke’s law and stretches 0.04 m under a 6 N force. The graph is a straight line through the origin, so the area is a triangle: ½ × 6 × 0.04 = 0.12 J of elastic potential energy. Students who forget the ½ lose the mark every time.
Current-time example: a steady 2 A current for 30 s is a rectangle: 2 × 30 = 60 C of charge. This is the graph version of Q = It.

Curved Graphs: Counting Squares and the Trapezium Rule
When the line curves, there are no neat triangles. Exam questions then ask you to estimate the area, and the method depends on the subject.
- • Count every whole square under the curve.
- • Pair up part squares: count a square if it is at least half under the curve, and ignore it if it is less than half.
- • Find the value of one square: its width in x-units multiplied by its height in y-units.
- • Multiply: number of squares × value of one square, and give the unit.
Maths: the trapezium rule. Split the area into equal-width strips, treat each strip as a trapezium, and add them. The formula is:
Here h is the strip width. Using four strips of width 1 under y = x² from 0 to 4 gives ½ × 1 × [0 + 16 + 2(1 + 4 + 9)] = 22. The exact area, found by integration at A-Level, is 21⅓.
½ × 1 × [0 + 16 + 2(1 + 4 + 9)] = 22. The curve bends upwards, so every strip slightly overshoots it.
A very common follow-up question asks whether your estimate is too big or too small. Look at the shape. If the curve bends upwards, like y = x², the straight tops of the trapeziums sit above it, so you have an overestimate. If it bends downwards, you have an underestimate. Using more, narrower strips makes the estimate more accurate.
Gradient or Area? A 5-Second Check
Many students lose marks before they start because they pick the wrong tool. Ask what the question wants:
When the question asks for a rate: speed, acceleration, how quickly something changes. Words to spot: "rate", "per second", "how fast".
When the question asks for a total: distance travelled, energy stored, charge that flowed. Words to spot: "how far", "total", "how much".
The same velocity-time graph can carry both questions: its gradient gives acceleration and its area gives distance. Reading the command words in IGCSE and A-Level exam questions carefully is what tells you which one the examiner wants.
Where Students Lose Marks on Area Questions
These are the errors I see most often when marking mock papers with students in Dubai and Abu Dhabi:
- Forgetting the ½ on triangles. It doubles the answer and loses both method and answer marks.
- Reading the scale wrong. One small square is rarely worth 1. Check what each grid line represents first.
- Mixing units. km/h on one axis and seconds on the other gives a meaningless area. Convert first.
- Stopping at the number. "108" is not a full answer. "108 m, the distance travelled by the car" is.
- Averaging speeds for the whole journey. Average speed is total distance ÷ total time, which means you need the area first.
Most of these are attention errors rather than gaps in understanding. Our guide to silly mistakes in maths exams and a 3-minute checking routine shows how to catch them before the paper is handed in.
Teacher Challenge: Read the Area
If you tried the challenge in the gradient article, this is the same graph. This time the question asks what the space underneath it means.
Graph Scenario: A cyclist’s velocity rises steadily from 0 m/s to 20 m/s in 4 seconds, then stays at 20 m/s for 3 seconds.
Teacher’s Takeaway
The gradient divides the axes. The area multiplies them. Multiply the units, and you know what the area means.
That single check works on every graph a student meets, from IGCSE motion graphs to A-Level force-time and power-time graphs. Together with the gradient and the y-intercept, it completes the three ideas that unlock nearly every graph question on the paper.
Ustaad supports students across the UAE with one-to-one, concept-led tutoring aligned to IGCSE, GCSE, A-Level and IB. Families can work with a physics tutor in Dubai, a physics tutor in Abu Dhabi or a maths tutor in Dubai. To find out exactly where the gaps are, book your first session with Tabraiz Khan.
No commitment. Cancel anytime.
Frequently Asked Questions
Cambridge Certified Maths & Physics Specialist
Cambridge Certified Teacher with a Master’s in Statistics and 9 years teaching Maths, Physics and Statistics across IGCSE, GCSE, A-Level, and IB curricula in Dubai and Abu Dhabi. Specialises in analytical concept building, kinematics, and exam mark-scheme precision.
Nimra Shahzada | Content Lead & Academic Consultant
Nimra Shahzada reviewed this article as part of Ustaad’s editorial process, checking that each explanation is clear and easy to follow for students and parents. She holds a Bachelor’s degree in Psychology and leads content at Ustaad UAE.
Book First Session with Tabraiz Khan
Work one-to-one with Cambridge Certified specialist Tabraiz Khan to master graph questions, from gradients to areas, across IGCSE, GCSE, A-Level and IB Maths & Physics.
No commitment · Cancel anytime
Meet the writers behind Ustaad UAE on our editorial page.